







































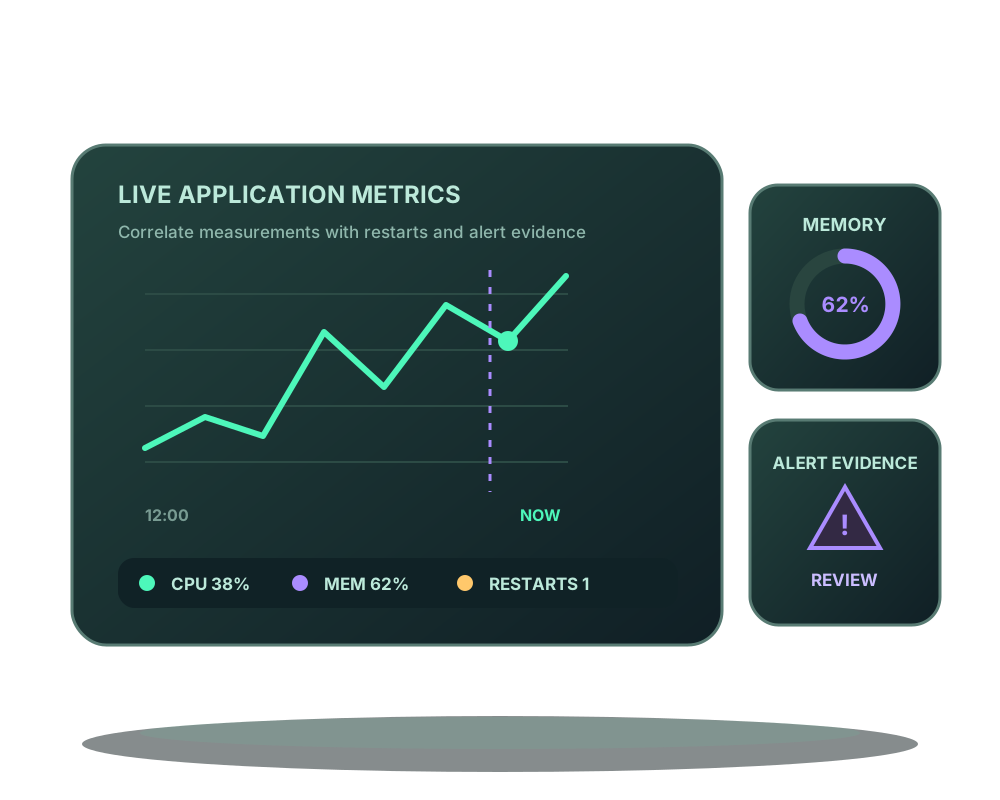
An application can still be reachable while memory rises or its container repeatedly restarts. Impreza’s Metrics & alerts view brings recent measurements and alert evidence into the same account where you manage the app. An authorized AI assistant can read that evidence through MCP.
This is container monitoring. It does not collect application traces, request contents or business metrics, and it does not automatically repair or restart an app.
Check the agent and open the app
Use an app managed by a compatible Impreza Agent, version 0.6.17 or later. Update the agent explicitly after active operations finish; installing a newer MCP package does not update the server. Local MCP 0.39.0+ exposes the documented workflow.
Open My Apps, select the application and find Metrics & alerts under Advanced. API inspection requires read permission; changing alert rules requires deploy permission. Account and resource authorization remain in effect.
Read the recent measurements
Through MCP, call impreza_app_metrics with the deployment ID. The optional minutes window accepts 5-129600 (about 90 days) and defaults to 120. Inspect container state, restart count, CPU percentage, memory use and limit, and estimated volume bytes.
Recent reads show minute points for up to 24 hours. Minute measurements are kept for 48 hours; older closed hours are consolidated into hourly points retained for 90 days. A longer query combines hourly history with recent minute points, with each point marked by its resolution. Current agents report one CPU sample per minute, so that reading remains an instantaneous sample. The platform can calculate a sample-weighted bucket average when an agent supplies multiple samples. Docker volume usage is an estimate. Compare timestamps and resolution with when the symptom occurred, and use application logs for the events behind a spike.
Missing data means unknown. It is not proof that an app is healthy, idle or consuming zero resources. Check the agent and collection path before diagnosing an empty chart as an application outage.
On servers with the updated proxy, proxy_metrics also reports aggregate request counts by status class, latency percentiles, transferred bytes and Shield outcomes for a routed app. Minute detail is kept for 48 hours; this is not a visitor-level log or long-term request history. The Shield guide explains what the protection counters do and do not show.
Choose a rule for a specific symptom
The supported rules are:
| Rule | What to configure |
|---|---|
| down | Threshold 1 for the unavailable condition |
| restart_loop | A restart-count threshold |
| memory_pct | 1-100 percent of the configured memory limit |
| cpu_pct | CPU threshold from 1-10000; 100 represents one full core |
| agent_offline | Threshold 1 when the agent is offline |
| backup_failed | Threshold 1 when a backup has failed |
Choose a duration from 1 to 60 minutes. For example, the following impreza_set_alert_rule arguments create an enabled memory rule after you replace the deployment ID:
{
  "deployment_id": "dpl_REPLACE_ME",
  "metric": "memory_pct",
  "threshold": 85,
  "duration_minutes": 3,
  "enabled": true
}
The example is a starting point, not a universal limit for every workload. Read existing rules first. Supply the existing rule ID when updating one, so you do not unintentionally create duplicate rules. CPU alerts are available; volume measurements do not imply a disk alert rule. agent_offline and backup_failed are evaluated by the platform’s minute check rather than an agent report.
Inspect alerts before deciding on a repair
Use impreza_list_alerts to read rules, open and resolved alerts, and their evidence. Compare the alert with current measurements and logs. A resolved alert records a condition change; it does not establish that every user-facing function works.
Review this app’s recent metrics and alerts. Explain the timestamps and evidence, then suggest the next read-only checks. Do not change rules or restart the app.
Use inspection and maintenance for the next diagnostic step. Keep an observation separate from authorization to perform a repair.
Review protection alongside app health
Agent 0.6.27 or later adds detailed Shield rule review and configurable protection for compatible routes. Aggregate WAF counts help investigate false positives; they do not identify individual visitors or prove an attack. Follow Impreza Shield to review challenges, request limits and temporary attack mode. These controls complement runtime metrics; they do not provide external uptime monitoring.
Decide whether notifications should leave the portal
Alerts are recorded in the portal even without an external notification destination. To notify your own system, configure an account webhook that includes deployment.alert. Rule creation and webhook subscription are separate operations with different permissions.
Follow platform events for destination rules, signatures, retries and duplicate handling. A webhook delivery is not a guarantee that a human has seen the alert. Read the metrics reference for current limits.